Average Keyword Ranking Metrics
Average Keyword Ranking is one of the metrics in the Stats dashboard that displays the average value of keyword ranking in a particular view tracked in Sequence. We take data from 1-100 rankings on SERP pages, then display the average value of organic and absolute rankings.
Read through the following guidelines to make it easier for you to read the data on the Average Keyword Ranking metrics.
How to Calculate Average Keyword Ranking?
Average keyword ranking is obtained from calculating the total ranking of keywords contained in a particular view, then divided by the total keywords in that view. The calculation of the average ranking does not include non-ranking keywords because it will affect the objectivity of the average ranking value.
Take a look at the following simulation.
| No | Keyword | Keyword position on SERP Yesterday | Keyword Position on SERP Today |
|---|---|---|---|
| 1 | SEO service | 80 | 82 |
| 2 | SEO consultant | 13 | 13 |
| 3 | Organic SEO service | 37 | 34 |
| 4 | Monthly SEO service | 19 | 14 |
| 5 | Learn SEO | >100 | >100 |
Table 1: Calculation of keywords averages ranking in a particular view.
To determine today's average ranking, please calculate today's total ranking by adding up each keyword rank (82+13+34+14+101). Then, divide by the number of keywords that rank.
avg ranking = (82+13+34+14+101) / 4
avg ranking = 61
Next, you need to determine the average change in ranking by calculating the difference between the previous day's average ranking compared to today's. When the difference is negative, meaning that the average ranking decreases, while if the difference is positive, the average ranking of your keywords has increased.
rank changes = 62.5 - 61
rank changes = (+) 1.5 // average rank has increased
For keywords with n/a or >100, the average rank will be taken from the organic max rank, which is 101.
Get to know the Graph Type in Average Keyword Ranking Metrics
There are several data visualization options in the Average Keyword Ranking, ranging from multiple line graphs, 2-panel line graphs, multiple column graphs, and tables. You can set the data display through the Switch Type Component option, then click the type of graph you want to display.
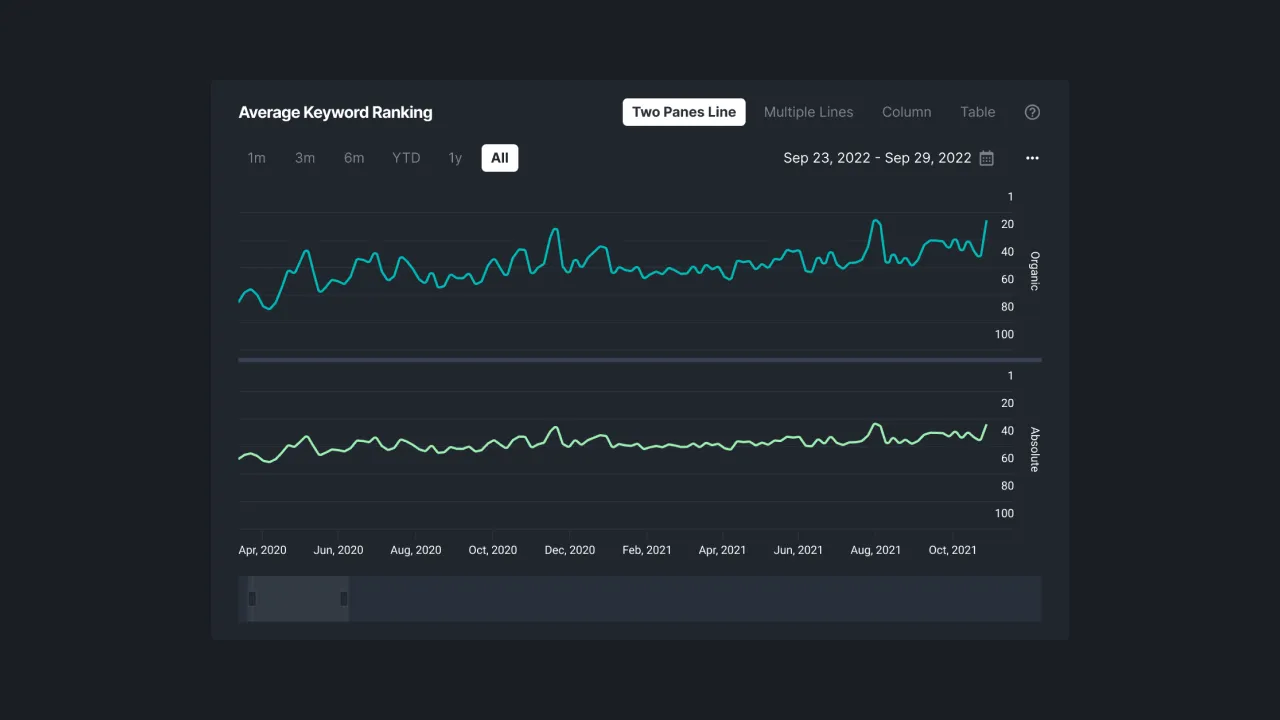
Two-Panel Line Chart
A two-panel line graph showing the average organic and absolute keyword rankings of a given view in two different panels. Users can view data based on a certain period of time or select data from the last few months, data from the beginning of the year to date to all average keyword ranking data.
Hover the mouse over any of the data in the line graph to see the details of the selected tracking date, the average organic or absolute ranking, and the change in value compared to the previous day.
 |
|---|
| Figure 1 - Two Panel Line Graph Average Keyword Ranking |
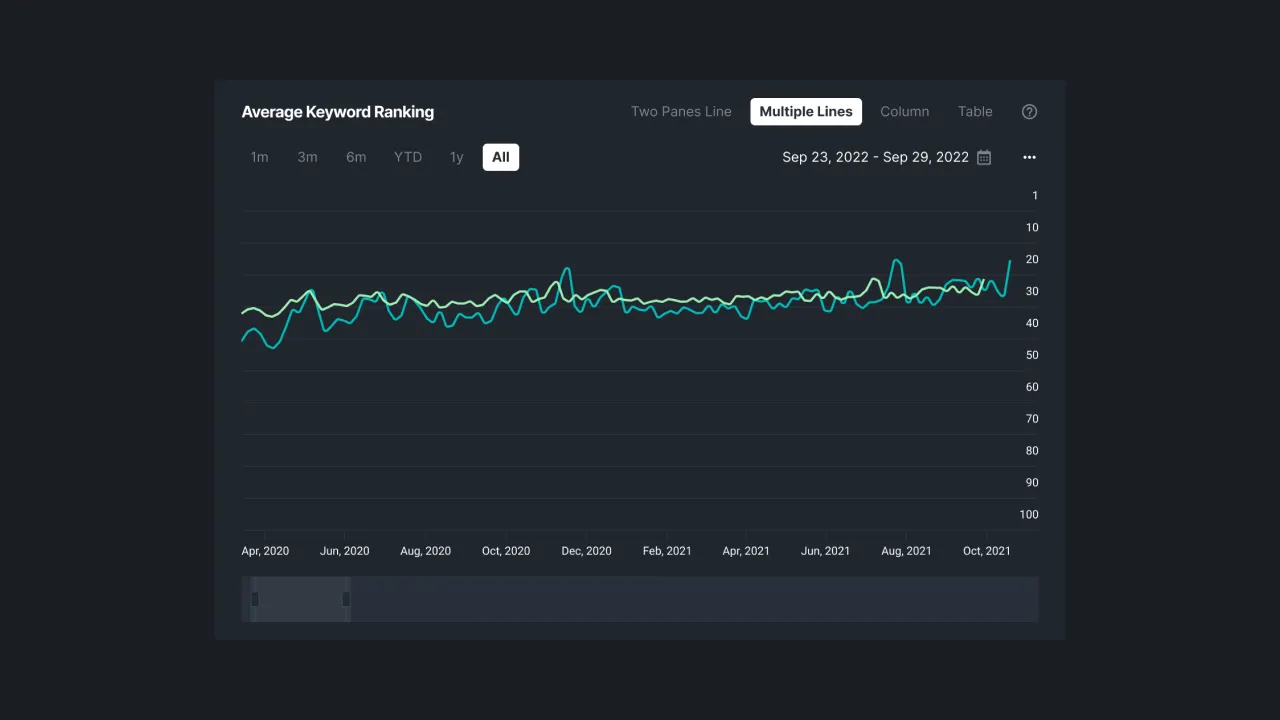
Compound Line Chart
The compound line graph displays the average ranking of organic and absolute keywords from a particular View in one panel which is distinguished using 2 different marker lines. The horizontal axis on this graph shows the tracking date, while the vertical axis shows the keyword ranking scale.
Users can view data for the last few months (1 month, 3 months, 6 months, 12 months), data from the beginning of the year to date, to all average keyword ranking data. Users can also display data based on a certain period of time by specifying the start date and end date via the calendar icon.
Point your mouse at one of the data contained in the compound line graph. Our system will display the details of the average keyword ranking in the selected view as well as the change in value compared to the previous day.
 |
|---|
| Figure 2 - Compound Line Graph of Average Keyword Rank |
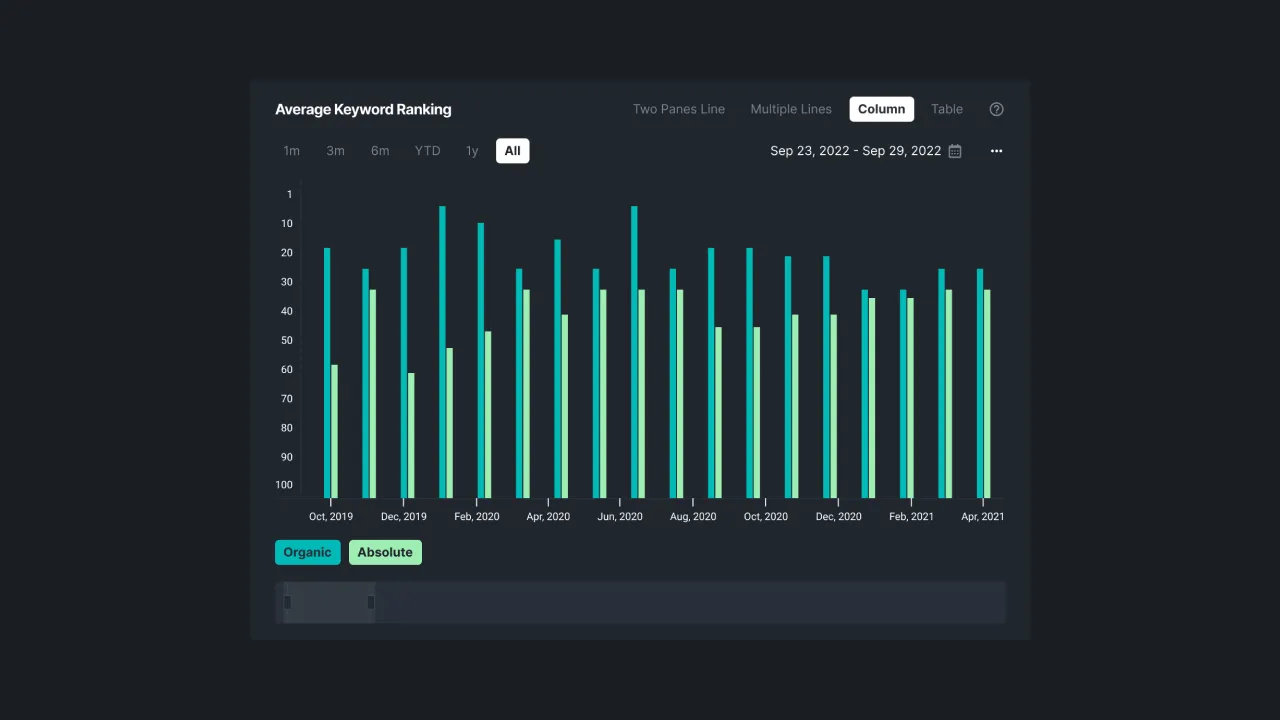
Compound Column Chart
The multiple-column graph displays the average organic and absolute keyword rankings of a particular view in a single panel which is differentiated using 2 different column markers. As with other charts, the horizontal axis on this chart contains the tracking date and the vertical axis represents the keyword ranking scale.
In this graph, users can view data based on a certain time period or choose to display data for the last few months, data from the beginning of the year to the current date, to all average keyword ranking data.
You can hover over any of the data in the column graph. The sequence will display the tracking date, the average organic or absolute ranking of the keyword, and the change compared to the previous day.
 |
|---|
| Figure 3 - Compound Column Graph of Average Keyword Rank |
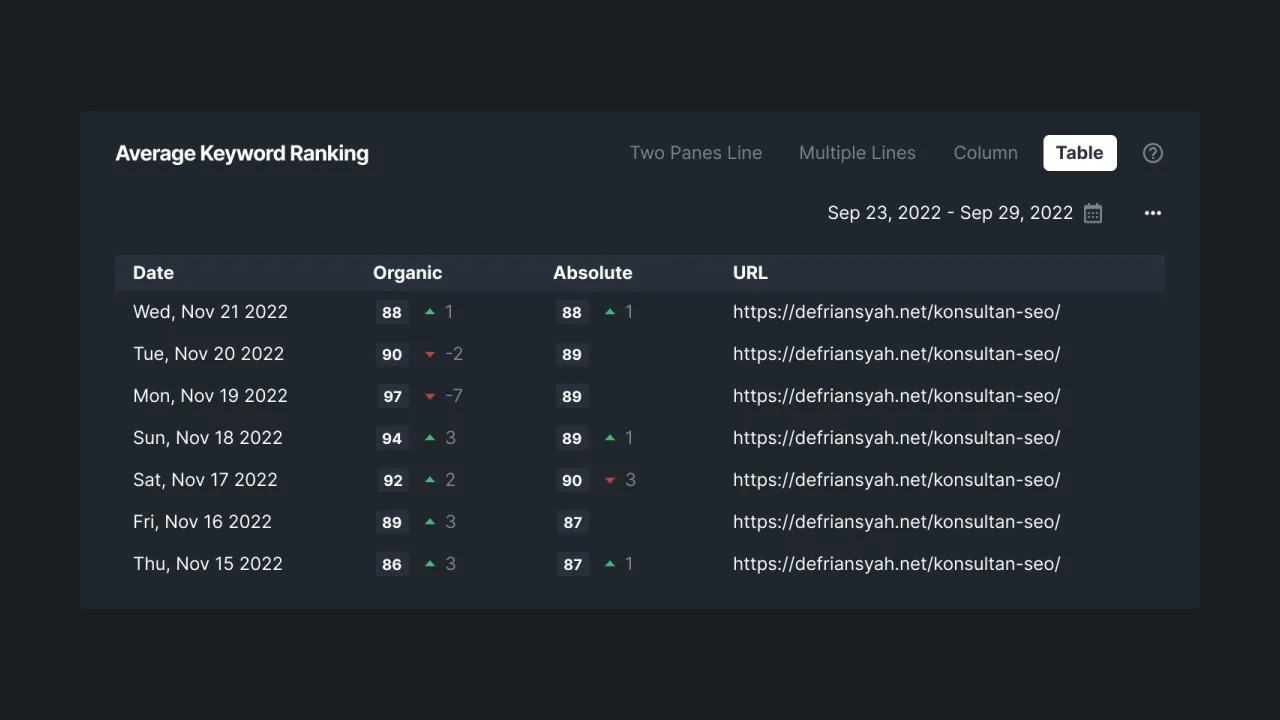
Table
The column structure contained in the Average Keyword Ranking table includes tracking date, average organic ranking, average absolute ranking, and their changes compared to the previous day.
The rating change label is marked in green if the average ranking has increased and in red if there has been a decrease. When the label is yellow, it means that the average ranking has neither increased nor decreased.
 |
|---|
| Figure 4 - Average Keyword Rank Table |
We offer you the convenience of monitoring the average ranking of all keywords in your domain. Improve your site's position in the SERPs with Sequence now! Contact us at support@sequence.day , and we will be happy to assist you.